
Page 74 - IPP-12-2025
P. 74
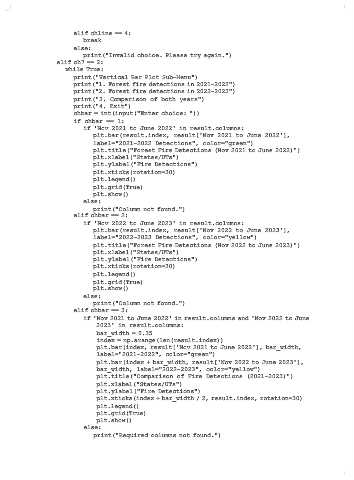
elif chline == 4:
                              break
                          else:
                              print("Invalid choice. Please try again.")
                    elif ch7 == 2:
                       while True:
                          print("Vertical Bar Plot Sub-Menu")
                          print("1. Forest fire detections in 2021-2022")
                          print("2. Forest fire detections in 2022-2023")
                          print("3. Comparison of both years")
                          print("4. Exit")
                          chbar = int(input("Enter choice: "))
                          if chbar == 1:
                              if 'Nov 2021 to June 2022' in result.columns:
                                 plt.bar(result.index, result['Nov 2021 to June 2022'],
                                 label="2021-2022 Detections", color="green")
                                 plt.title("Forest Fire Detections (Nov 2021 to June 2022)")
                                 plt.xlabel("States/UTs")
                                 plt.ylabel("Fire Detections")
                                 plt.xticks(rotation=30)
                                 plt.legend()
                                 plt.grid(True)
                                 plt.show()
                              else:
                                 print("Column not found.")
                          elif chbar == 2:
                              if 'Nov 2022 to June 2023' in result.columns:
                                 plt.bar(result.index, result['Nov 2022 to June 2023'],
                                 label="2022-2023 Detections", color="yellow")
                                 plt.title("Forest Fire Detections (Nov 2022 to June 2023)")
                                 plt.xlabel("States/UTs")
                                 plt.ylabel("Fire Detections")
                                 plt.xticks(rotation=30)
                                 plt.legend()
                                 plt.grid(True)
                                 plt.show()
                              else:
                                 print("Column not found.")
                          elif chbar == 3:
                              if 'Nov 2021 to June 2022' in result.columns and 'Nov 2022 to June
                                  2023' in result.columns:
                                  bar_width = 0.35
                                  index = np.arange(len(result.index))
                                  plt.bar(index, result['Nov 2021 to June 2022'], bar_width,
                                  label="2021-2022", color="green")
                                  plt.bar(index + bar_width, result['Nov 2022 to June 2023'],
                                  bar_width, label="2022-2023", color="yellow")
                                  plt.title("Comparison of Fire Detections (2021-2023)")
                                  plt.xlabel("States/UTs")
                                  plt.ylabel("Fire Detections")
                                  plt.xticks(index + bar_width / 2, result.index, rotation=30)
                                  plt.legend()
                                  plt.grid(True)
                                  plt.show()
                              else:
                                 print("Required columns not found.")


              A.18